What Are Support and Resistance Levels?
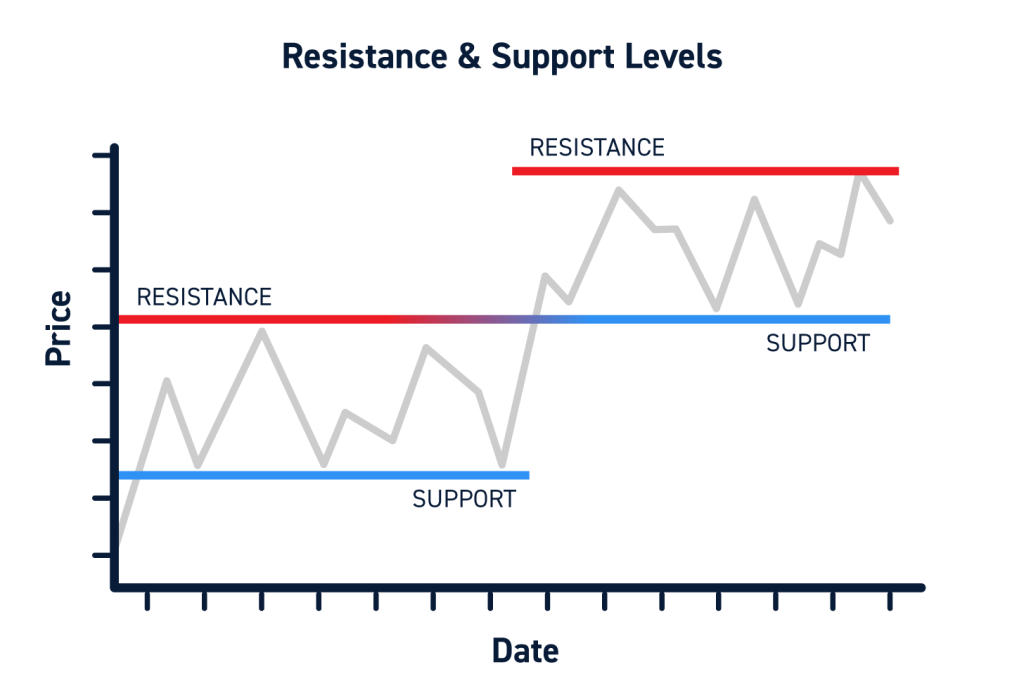
Support and resistance levels are crucial concepts in trading that help traders make informed decisions. Support levels indicate a price point where a declining market tends to stop falling and reverse upward. Conversely, resistance levels represent price points where an increasing market typically finds it hard to continue upward and begins to drop back down.
How to Identify Support and Resistance Levels
Identifying these key levels can be achieved using various methods, such as analyzing historical price charts. One common method is to look for price points that have previously acted as barriers. For instance, if a stock price has bounced off a certain level multiple times, that price can be seen as a support level. Traders often mark these levels on charts, making it easier to visualize where price movements might occur.
Practical Examples with Visuals
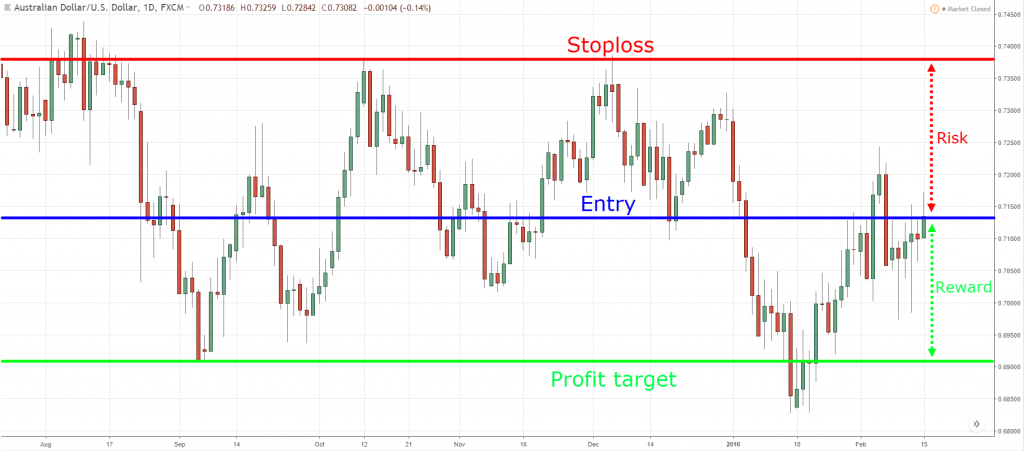
To enhance understanding, consider the examples below:


In these charts, you can observe how the price interacts with support and resistance levels. The price tends to bounce back at the support level and struggles to break through the resistance level. Recognizing these patterns is essential for traders aiming to predict future movements and make strategic decisions.
In conclusion, grasping support and resistance levels is fundamental for successful trading. By utilizing visual examples and understanding how these levels function, traders can better navigate the complexities of the market.
Share this content:
